Source: U.S. Environmental Protection Agency; CP staff
The EPA has released 2020 greenhouse gas (GHG) data collected under the Greenhouse Gas Reporting Program (GHGRP). Reported carbon dioxide and methane emissions from large industrial sources were approximately 9 percent lower than in 2019, reflecting both the economic slowdown due to the Covid-19 pandemic, and ongoing, long-term industry trends.
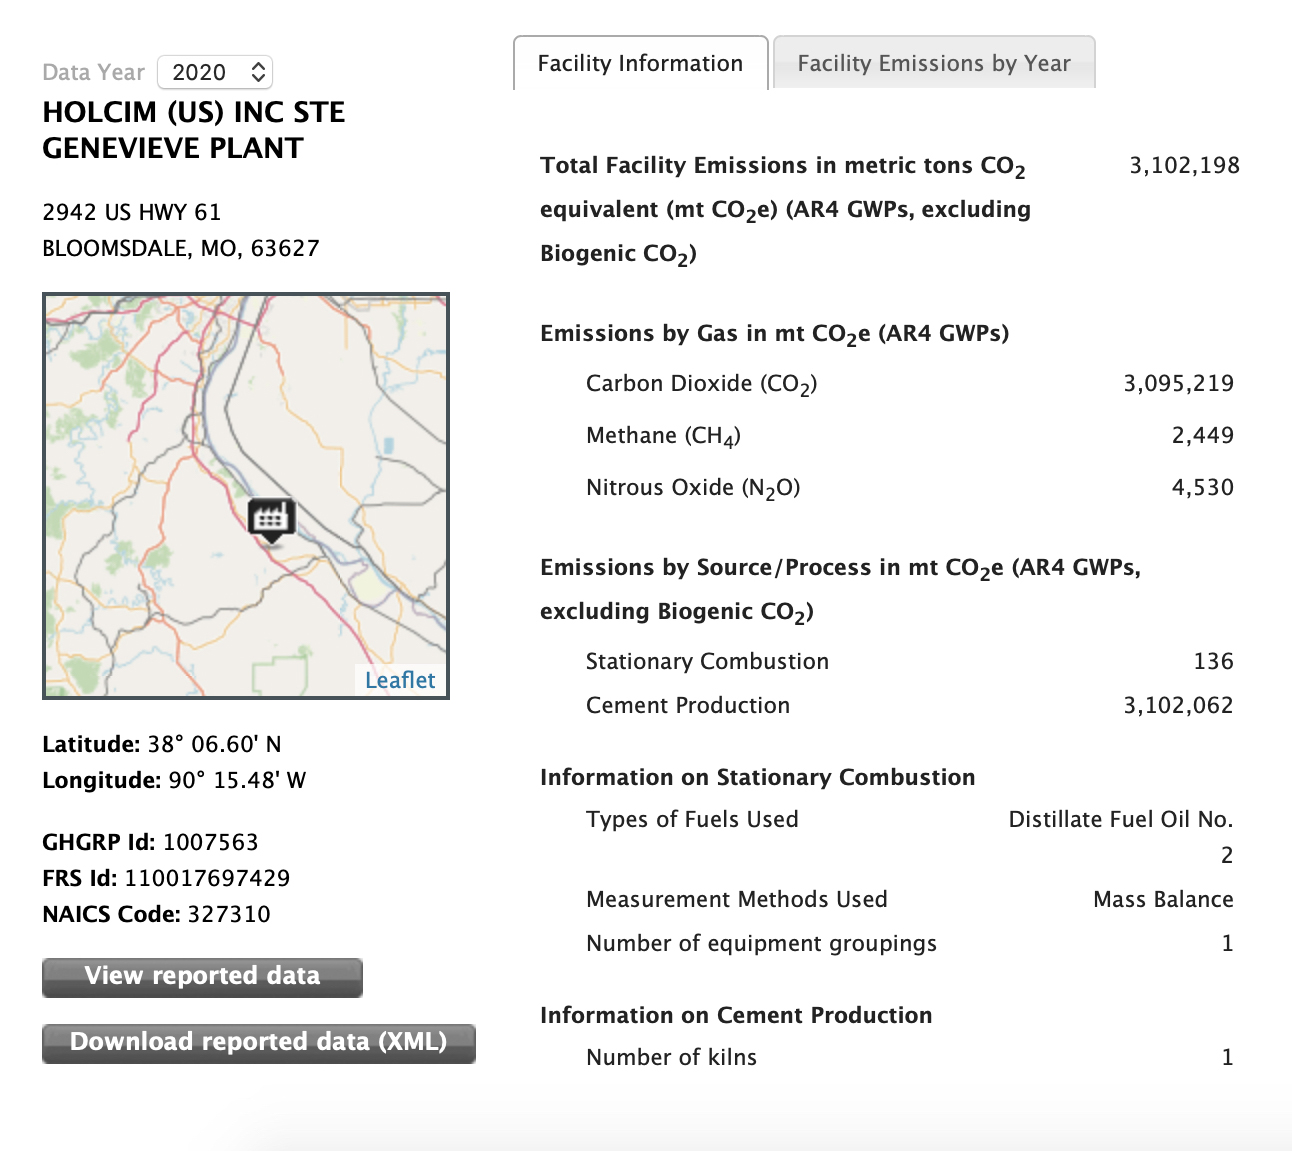
GHGRP adds a new demographic mapping layer to EPA’s Facility Level Information on Greenhouse gases Tool (FLIGHT) with this year’s data publication. The Program is also releasing a new “dashboard” to view data on demographic indicators in proximity to GHGRP reporting facilities by industry through interactive maps, graphs and charts.
“The Greenhouse Gas Reporting Program is supporting [emissions reduction] efforts by providing high-quality, long-term-data for the largest emitters, and contributing important details on greenhouse gas emissions trends,” contends EPA Office of Air and Radiation Acting Assistant Administrator Joseph Goffman.
Data from 8,100-plus large facilities reporting emissions of CO2 and other greenhouse gases show that in 2020:
- Power plants were the largest stationary source of U.S. greenhouse gas emissions reporting to the GHGRP, with 1,339 facilities emitting approximately 1.5 billion metric tons of CO2. Reported power plant emissions in 2020 declined by 10 percent between 2019 and 2020, and nearly 33 percent since 2011 reflecting both changes in electricity use during the Covid-19 pandemic, as well long-term power sector fuel-stock shifts from coal to natural gas.
- Petroleum and natural gas systems were the second largest stationary source, reporting 316 million metric tons of greenhouse gas emissions. Reported emissions for 2020 were 9 percent lower than in 2019, but 11.6 percent higher than 2016. (2016 is the earliest year of comparable data for this sector, as new industry segments began reporting that year.)
- Reported emissions from other large sources in the industrial and waste sectors were a combined 2,286 million metric tons of greenhouse gas emissions in 2020, down 8.9 percent from 2019, and down 26 percent since 2011.
This is the eleventh year of data collection for most sectors under the GHGRP. As directed by Congress, EPA collects annual, facility-level emissions data from major industrial sources, including power plants, oil and gas production; cement, iron and steel mills; plus landfills. GHGRP gathers direct emissions information from the largest stationary sources in the U.S., representing approximately 50 percent of the country’s total greenhouse gas emissions, along with fossil fuel suppliers. A complete accounting of total U.S. GHG emissions is available through a separate EPA report, Inventory of U.S. Greenhouse Gas Emissions and Sinks. — www.epa.gov/ghgreporting
Related article