Sources: U.S Geological Survey; Rock Products The U.S. Geological Survey has updated its Top 100 Producers Of Crushed Stone and Top 100 Producers of Sand & Gravel lists, reflecting 2022 shipments and compiled from data available through October 2023. Seven operators—three based in North America, four Europe—are among the leaders on both lists: TOP 10 PRODUCERS BY 2022 VOLUME Crushed…
Read MoreTag: sand & gravel
Crushed stone, sand & gravel top guns maintain grip in USGS rankings
Sources: U.S. Geological Survey; Rock Products, CP staff Nine publicly traded and four privately held companies populate the upper ranks of U.S. Geological Survey Mineral Commodity Specialist Jason Willett’s new “Top 100 Crushed Stone” and “Top 100 Sand & Gravel” producer surveys. Based on his analysis of 2021 shipments, here in descending order are the top players in each category: …
Read MoreAtlas tracks sand & gravel, crushed stone sites from Maine to Maui
Source: Rock Products
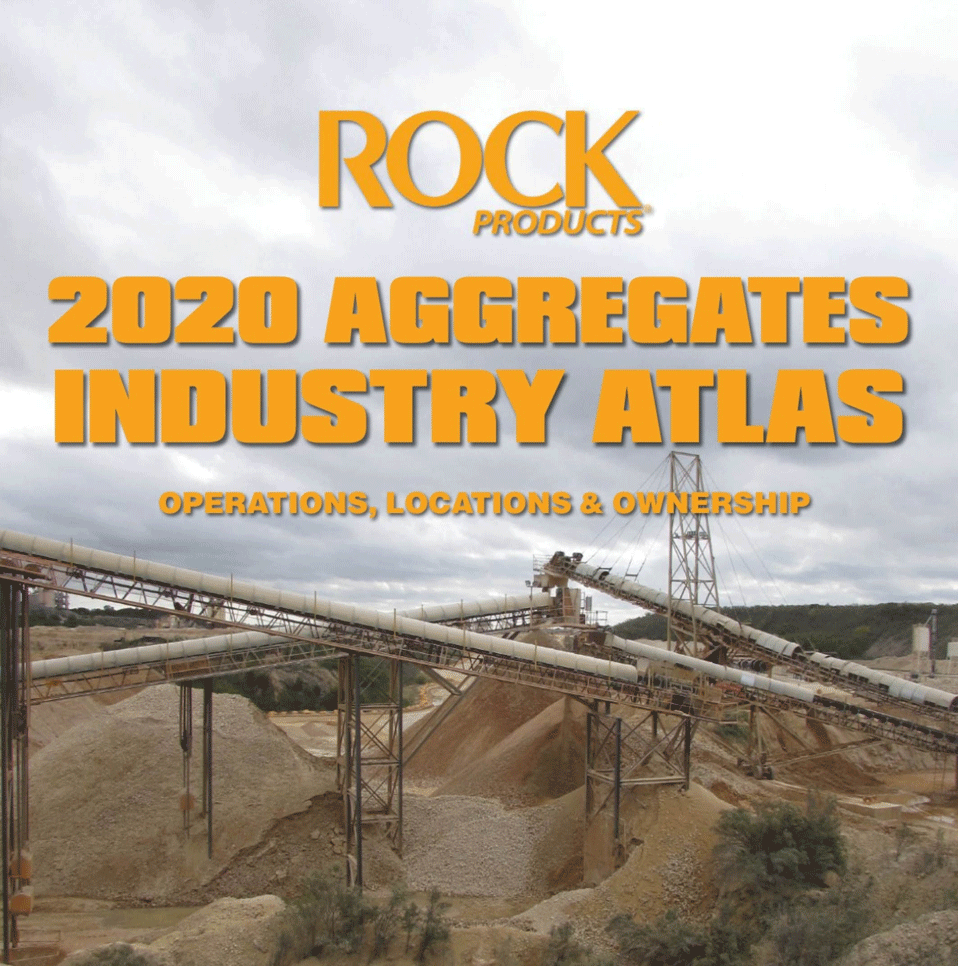
Rock Products magazine has released an exhaustive directory of sand & gravel and crushed stone operations in conjunction with its April edition. The 2020 Aggregates Industry Atlas maps more than 6,000 crushed stone, sand & gravel, and dredging operations state-by-state; plus, a companion directory provides contact details and parent company references where applicable.
Read MoreSand & gravel production, use survey measures concrete prevalence
Sources: U.S. Geological Survey; CP staff
The annual USGS Mineral Commodity Summaries estimates 2019 construction sand & gravel production at 970 million metric tons, valued at $9 billion and extracted from 6,830 sites operated by 3,870 companies. In order of decreasing tonnage, the lead states for production were Texas, California, Arizona, Minnesota, Michigan, Washington, Ohio, New York, Utah and Colorado—accounting for upward of 55 percent of total U.S. output.
Read MoreProducer fragmentation higher in sand & gravel than crushed stone
Sources: U.S. Geological Survey; CP staff
Top 20 sand & gravel and crushed stone producer rankings from USGS Commodity Specialist Jason Willett show strong contrasts in market concentration and operational scale. Producers on the just-released sand & gravel ranking accounted for 30 percent of shipments in 2016, the most recent year for which consolidated figures are available. For the same period, the agency’s crushed stone ranking showed a) the top 20 producers responsible for 743 million mt or 55 percent of the 2016 U.S. output; and, b) the top 100 operators shipping 1.02 billion mt of crushed limestone and granite, or 75 percent of industry deliveries.
Read MoreOldcastle Materials, Vulcan, Lehigh Hanson lead sand & gravel ranks
Sources: U.S. Geological Survey; CP staff
The top 20 construction sand & gravel producers by volume accounted for 269 million metric tons (mt) or 30 percent of total shipments for 2016, the most recent year for which consolidated figures are available. The top 100 producers on USGS Commodity Specialist Jason Willett’s current ranking combined for 426 million mt, or 48 percent of agency-tracked 2016 sand & gravel production. The top 10 producers are Oldcastle Materials Inc., Vulcan Materials Co., Lehigh Hanson Inc., LafargeHolcim, Cemex USA, MDU/Knife River Corp., Martin Marietta Materials, Granite Construction Inc., Mitsubishi Cement Corp., and Summit Materials.
Read More