Shaving off 1 minute of time at the plant could save $832 per truck annually.
Managing ready mix concrete logistics is best summarized by an adaptation of the Serenity Prayer: Grant me the serenity to accept the things I cannot change, the courage to change the things I can and the wisdom to know the difference.
Dispatchers cannot change the weather or traffic, and they can’t force the finishing crew to show up on time at the jobsite. However, they can control much of what goes on at the plant. This means saving money on round-trip delivery cycles starts with shortening trucks’ time spent at the plant.
MEASURING TRUCK TIMES
When it comes to determining the time trucks spend at the plant, two measures stand out. First, the “time ticketed” approach measures the time between when the allocated batch was instructed to begin and when loading of that batch onto the truck starts. Second, the “loaded time at plant” approach measures the time between the end-loading of the truck and its departure from the plant. Let’s look at these measures, the commonsense ways to reduce them and, most importantly, their financial implications.
For the purposes of this column, we will use data from the National Ready Mixed Concrete Association’s Performance Benchmarking Survey 2020. Variable and fixed delivery costs average $1.01 and $0.27 per minute, respectively, with a total delivery cost of $1.28 per minute. On average, one truck delivers 5,648 cubic yards of concrete per year using 1,883 hours to yield 3 cubic yards per hour, with a total per-truck cost of $144,589 annually. For a producer of 1 million cubic yards per year, the annual truck costs would be $25.6 million. That’s enough to catch most people’s attention.
The impact of reducing 1 minute of total round-trip time based on 650 round trips per year would save $832 per truck annually and $147,300 (0.58 percent) for a fleet capable of delivering 1 million cubic yards. This bears repeating. If you deliver 1 million cubic yards of concrete annually, every minute that is cut from the average round-trip time will save an additional ~$150,000.
Based on nationwide patterns, good benchmark numbers to use are 9.5 minutes for time loaded at the plant and 3.5 minutes for ticketed time. No matter which measurement you use, if your time is lower than the benchmark, you can calculate your relative advantage over the competition by multiplying $832 per truck by each minute saved. Conversely, each minute you are over the benchmark equals to an $832/truck/year disadvantage.
LIMITING TIME SPENT AT PLANTS
To shorten the round-trip delivery time, you must first take accurate measurements. You’ll need to have modern systems in place that can precisely track the truck times between each station. Cloud-based fleet management systems like Digital Fleet provide real-time data and analytics as well as modern, core dispatch systems.
“To understand productive versus unproductive time, you have to first be able to automate and combine information from the truck, dispatch and batch panels,” says Tim Oakes, CEO of Digital Fleet.
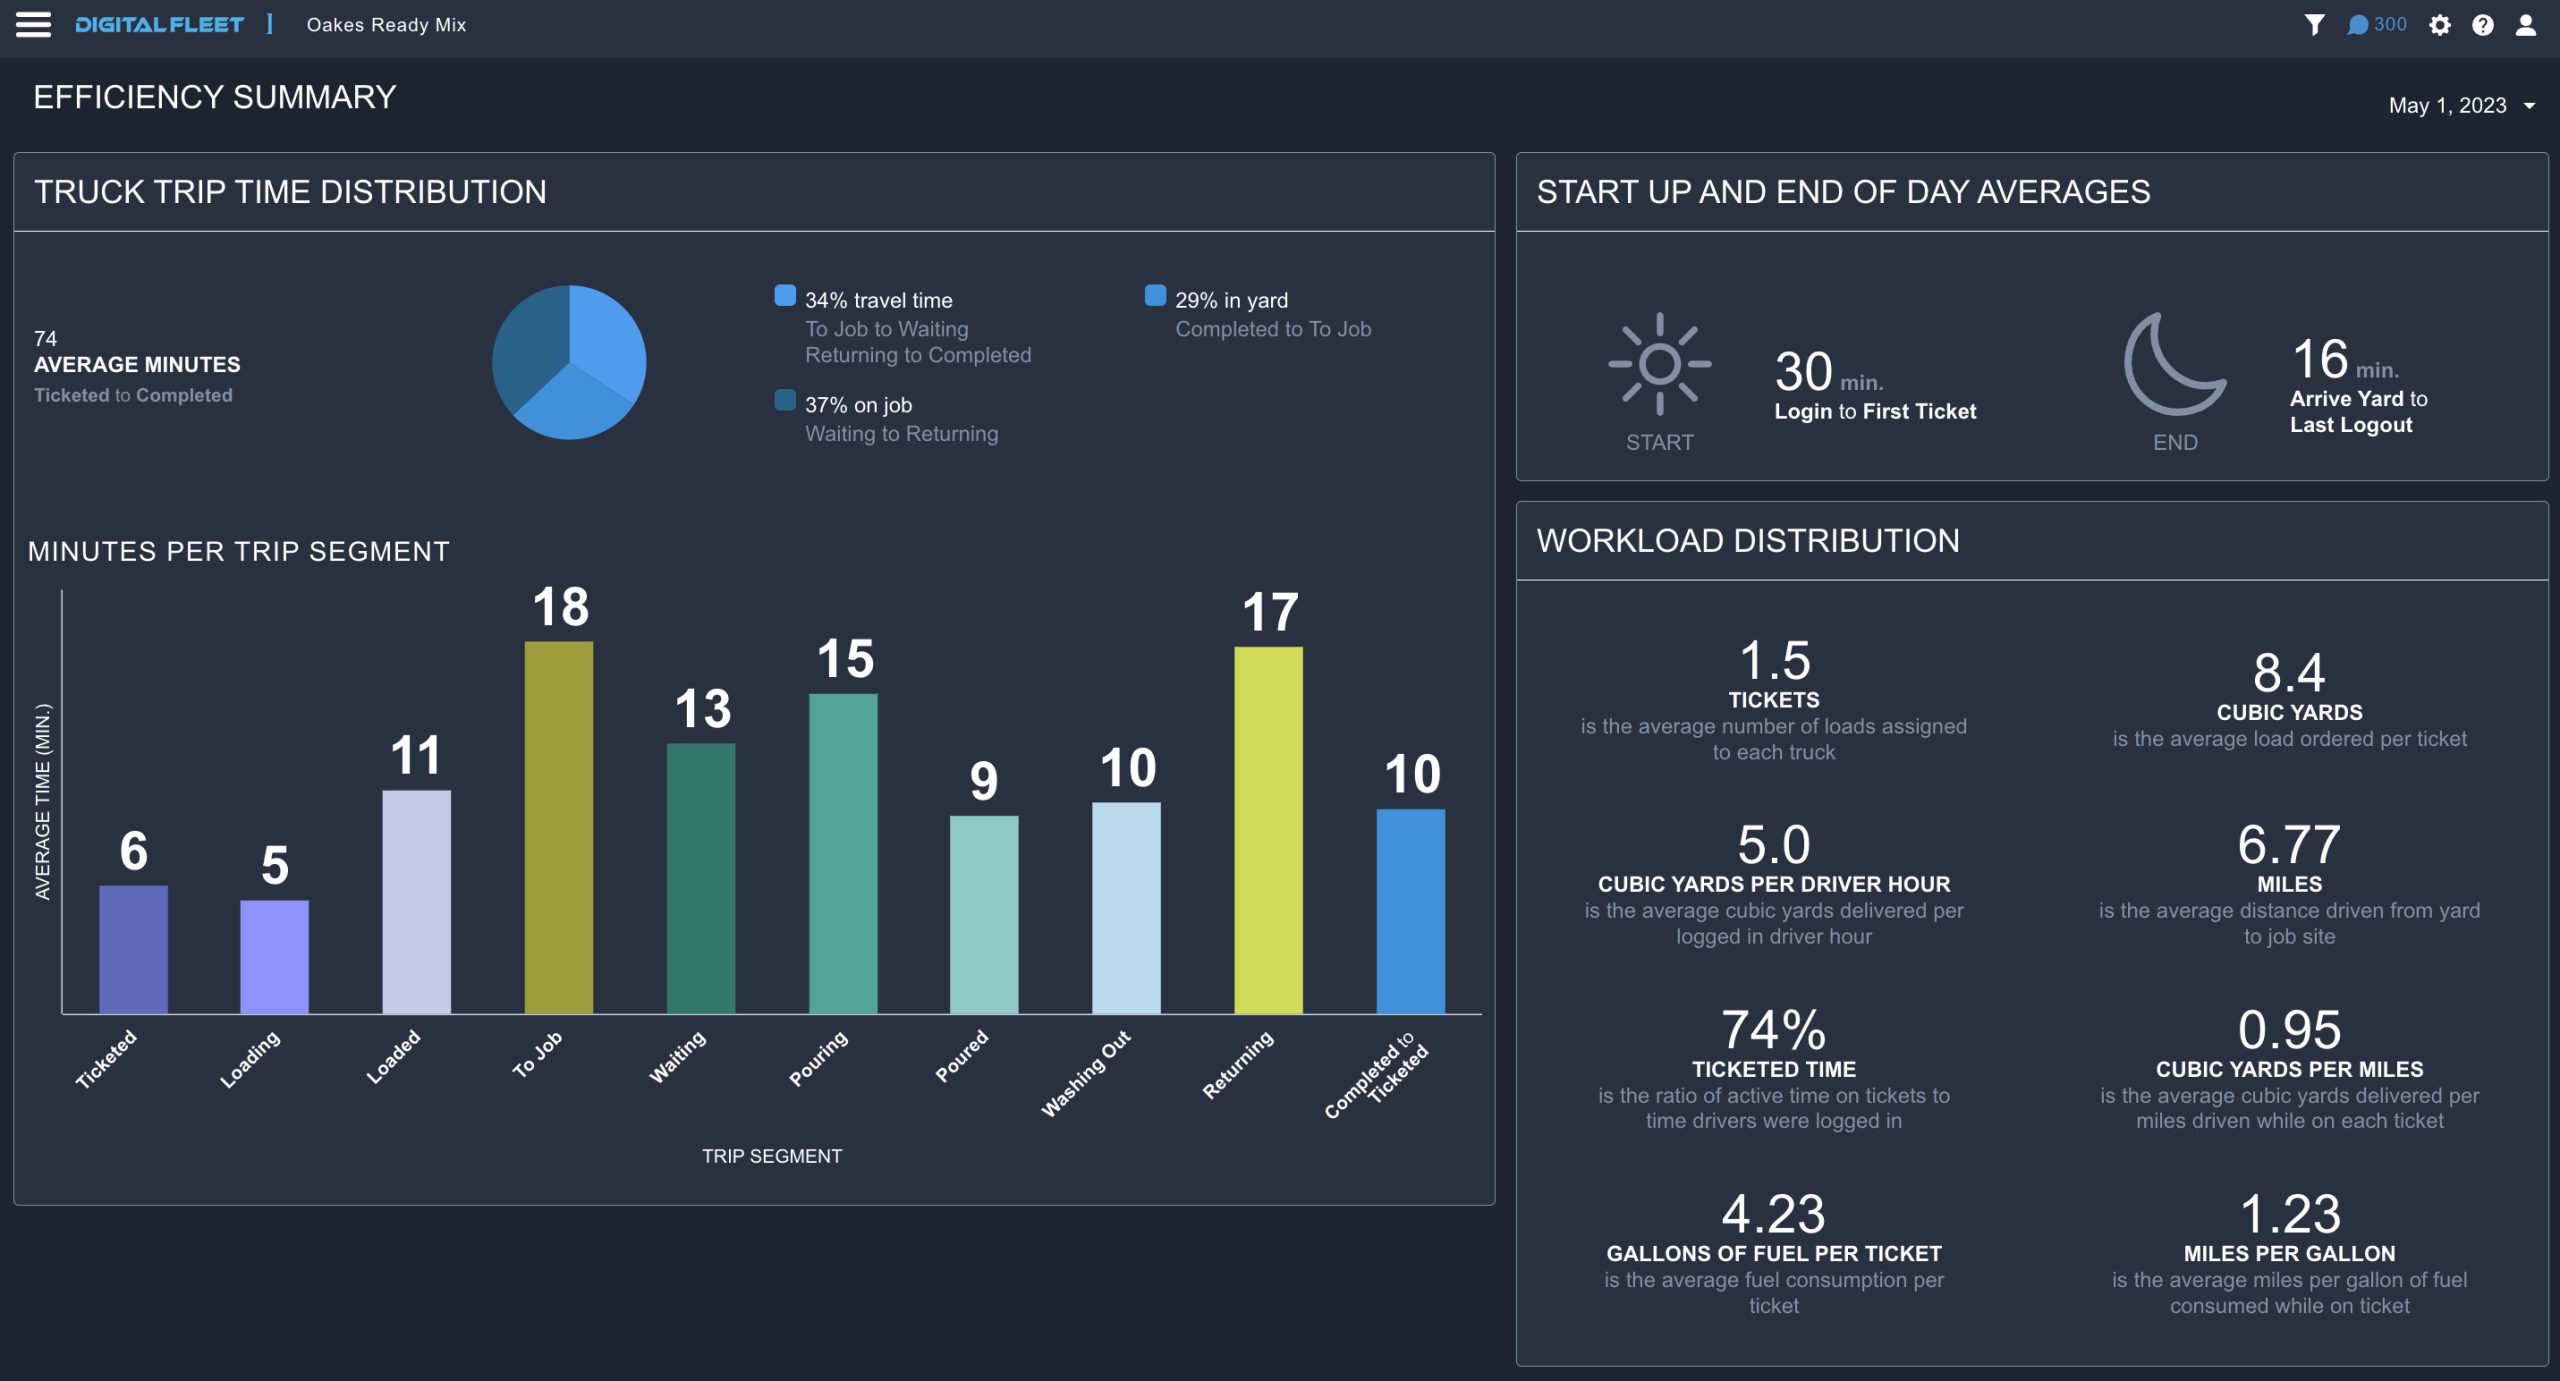
“With the right technology in place, you can automate every step of the ticket-status loop,” he explains. “Load events can be captured automatically, and timers displayed to the driver. You can then see your total ticketed time across your fleet—the ratio of active time on tickets versus the time drivers were in the truck waiting. This information, combined with data from the truck, shows your true efficiencies to help reduce waste and variability in your operation. Cubic yards per driver hour, gallons of fuel per ticket, miles per gallon, etc. can be seen in real time and archived daily for future use.”
The next step is to use selective real-time alerts backstopped by weekly reporting. Real-time alerts are great for immediately informing a plant or area manager when a driver exceeds performance thresholds, but this method might end up sending too many alerts. When the phone starts pinging like popcorn, it will likely get ignored. A better strategy is to use weekly backward-looking reports to target the worst offenders and then use real-time alerts to keep reminding them that they can do better.
A quick survey of many proficient producers yields a surprising variance in their trucks’ “time loaded at plant” measure. Depending on your plant configuration—or more specifically, your willingness to reconfigure the traffic pattern and add automated slump and washout—it is possible to reduce this measure by several minutes. Remember: Each minute saved will reduce each truck’s cost by around $832 a year.
The key takeaway is that improvement anywhere in the delivery cycle will produce savings. While anytime we can encourage a customer to reduce the waiting time of trucks onsite is a tangible win, their behavior is not something we can fully regulate. Surely, we should start with the things we can control.
Craig Yeack has held leadership positions with both construction materials producers and software providers. He is co-founder of BCMI Corp. (the Bulk Construction Materials Initiative), which is dedicated to reinventing the construction materials business with modern mobile and cloud-based tools. His Tech Talk column—named best column by the Construction Media Alliance in 2018—focuses on concise, actionable ideas to improve financial performance for ready-mix producers. He can be reached at [email protected].