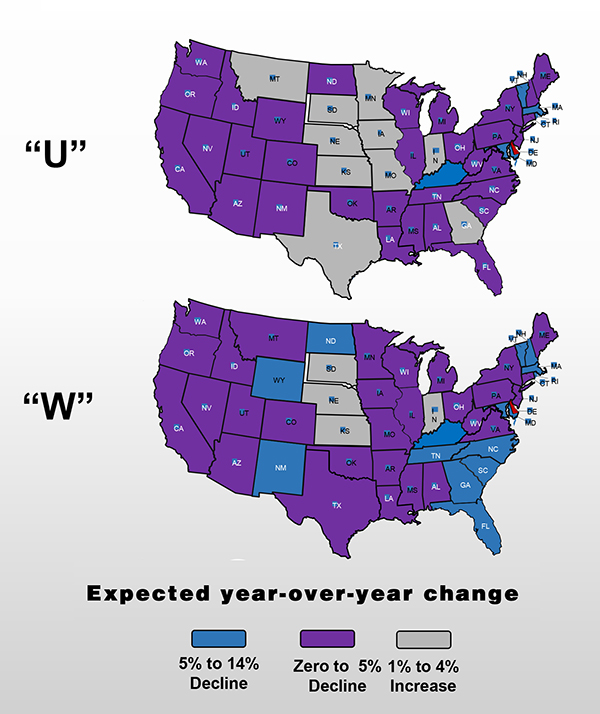
Portland Cement Association Chief Economist and Senior Vice President Ed Sullivan offers two U.S. cement consumption scenarios around “U” or “W” shaped economic recovery curves, with respective 2020 and 2021 figures of -3.4 percent or +1.7 percent and -4.8 percent and -2.7 percent—both years measured against 2019 industry shipments.
In “Coronavirus Impacts on the US Cement Industry,” the first widely available PCA Market Intelligence briefing since early March, he traces the curves from sharp, deep declines, the U model indicating a slow recovery and W the same, but a slide back into recession due to a significant rise in infections. In year-over-year terms, a U recovery would bring 2021 low single digit (< 5 percent) cement consumption gains in Georgia, Indiana, Iowa, Kansas, Minnesota, Montana, Nebraska, South Dakota and Texas, while most other states experience declines of 5 percent or less. A W recovery model would bring flat market conditions or moderate declines in most states, excepting parts of New England, much of the Southeast plus North Dakota, Wyoming and New Mexico, where cement consumption could drop from 5 percent to 14 percent over the 2020-2021 window. The W model would confine minor, projected gains in Indiana, Kansas, Nebraska and South Dakota for the same period.
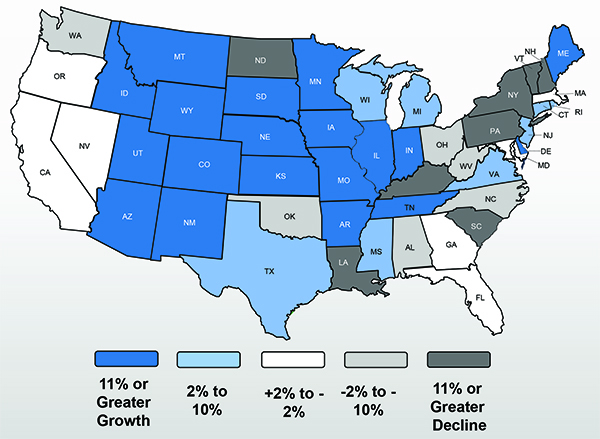
The 2020-2021 prospects for cement consumption and concrete deliveries hinge partly on declining state tax receipts’ impact on public construction contract activity. PCA Market Intelligence notes in “Coronavirus Impacts” how revenues will trend at 2020 year end and into 2021. Nearly one-third of states will finish this year with revenues off 6 percent-plus against 2019 levels, most others realizing 2 percent to 6 percent declines. Tax collections stand to slightly improve in 2021, with more than 40 states realizing declines under 6 percent.
As a lead into the 2020-2021 industry projections, “Coronavirus Impacts” cites a mixed bag of cement consumption trends for the first half of this year across nine U.S. Geological Survey districts. Year-to-date gains in West North Central (19 percent) and Mountain (14.3 percent) contrast with laggards East South Central (-3.1 percent) and Middle Atlantic (-9.9 percent). In sum, the industry saw year-over-year cement consumption up 2.2 percent for the first half of 2020.
Next up, PCA Market Intelligence is preparing a “Vaccine Scenario,” where a vaccine or therapeutic drugs reach mass distribution by mid-2021, reducing uncertainty and resulting “in dramatically improved consumer confidence [and] significantly stronger economic growth during the second half of 2021.”
CEMENT CONSUMPTION
January-June 2020
2020-2021 CEMENT PROSPECTS
Economic recovery models’ powder consumption trends
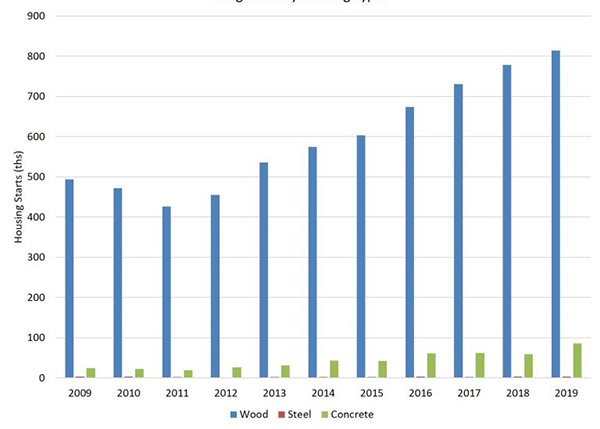
CONCRETE HOME VOLUME DOUBLES
Annual concrete-framed home completions climbed from 42,000 to 86,000 over the 2015-2019 window, according to a National Association of Home Builders analysis of U.S. Census Bureau data. With lumber prices up more than 170 percent from mid-April through mid-September, the National Ready Mixed Concrete Association cites market conditions favorable for alternatives to conventional wood building methods. The group observes single-family housing activity in tandem with its Concrete Design Center, which supports stakeholders across low- to mid-rise commercial building and multi-family residential development.
SINGLE-FAMILY HOME FRAMING TYPES