Technology Trends’ Craig Yeack breaks down cement savings and carbon dioxide emissions reduction math in a report on ready mixed production and the CarbonCure Technologies process. Outside of fly ash, admixtures and blended binders, CarbonCure’s dosing and injection technology is among the most widely adopted tools for lowering embodied carbon in finished concrete.
Joining the Nova Scotia-based developer and licensor in carbon streamlining is CarbiCrete. In partnership with Quebec hardscape producer Patio Drummond, Montreal-based CarbiCrete is testing CO2-based curing of concrete masonry units produced from steel slag-rich mixes. The companies aim to address the embodied carbon factor in concrete masonry on the front end, with cement-optimized mixes, and back end, with CO2 gas offsetting typical kiln energy consumption.
Elsewhere this month, we see renewable energy infrastructure driving embodied carbon levels down farther. On the heels of successful mason supply yard and fleet maintenance facility panel installations, Connecticut’s O&G Industries has stepped up solar polar harvesting with an expansive array feeding ready mixed, aggregate and asphalt production equipment. In a tandem item, GCC of America outlines a major contract to draw wind-derived power for its Rapid City, S.D., mill.
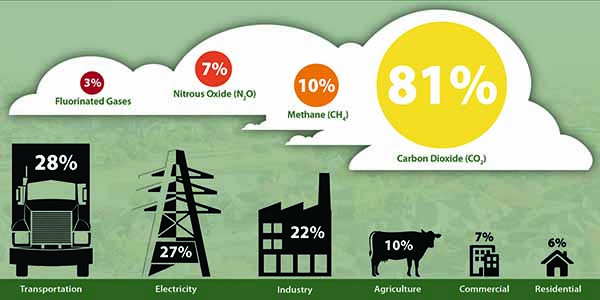
Renewable-energy exploitation, plus adoption of processes like those of CarbiCrete and CarbonCure Technologies, time with broader CO2 reduction across the economy. The Environmental Protection Agency’s just-released 2020 report on nationwide greenhouse gas (GHG) emissions proves how the United States continues to cut CO2 levels disproportionate to economic output. Emissions in 2018 were down 10 percent against 2005 levels, while the economy over that 13-year span grew 25 percent. Carbon dioxide leads EPA-tracked GHG, which also include methane, nitrous oxide, hydrofluorocarbon, perfluorocarbon, sulfur hexafluoride and nitrogen trifluoride gases.
| EPA GHG EMISSIONS INVENTORY |
 |
According to “Inventory of U.S. Greenhouse Gas Emissions and Sinks: 1990–2018,” cement production—the most visible aspect of new-construction activity in national GHG figures—contributed 40.3 million of the 5.4 billion metric tons, or 7.5 percent, of CO2 generated in 2018. Cement joins Iron & Steel, Petrochemical, Ammonia and Lime Production in the top five GHG sources reported in the EPA Inventory’s Industrial Processes and Product Use (IPPU) chapter. IPPU emissions fall within Industry End-Use, which accounts for 22 percent of GHG emissions in the 2018 Inventory, behind Transportation and Electricity (28 percent, 27 percent) and ahead of Agriculture, Residential and Commercial (≤ 10 percent).
As this column has necessarily repeated, the carbon dioxide aspect of cast-in-place or precast concrete and unit masonry is complicated. The unpeeling of carbon math layers continually shows cement and concrete producers making notable strides within a much greater universe painted in the EPA Inventory of GHG emissions.